- Security
- Privacy
- Performance
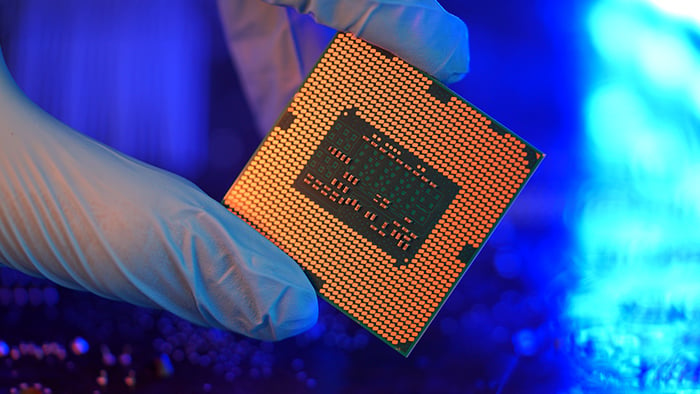
High CPM temperatures can cause your PC to overheat, potentially leading to problems like system crashes or hardware damage. Learn how to check core temps on Windows and monitor CPU temps with specialized software. Then, help keep heat levels down by clearing out junk files and reclaiming gigabytes of storage space with a reliable PC optimization tool.

This Article Contains
This Article Contains
Check your CPU temperature on Windows 10/11
The easiest way to check your CPU (central processing unit) temperature is to install a free tool to monitor heat levels, including spikes or anomalies. But you can also check current temps without downloading software using CPU Monitor, part of Windows’ built-in BIOS/UEFI tool.
Using BIOS/UEFI
Your PC’s BIOS/UEFI (system firmware) includes a built-in CPU temperature check. It shows the temperature when the system is idle, so the reading is usually lower than during normal use. It also only displays the current temperature, meaning it can’t monitor changes over time.
BIOS (Basic Input/Output System) and UEFI (Unified Extensible Firmware Interface) are firmware types that initialize your computer’s hardware and start the operating system. UEFI is standard on most modern devices (including Windows 11), but the terms are often used interchangeably.
Method 1: During startup
-
Go to Start > Power button > Restart.
-
As your computer starts up, repeatedly press the key indicated on the screen (usually Delete, F2, F10, Esc, or F12).
-
Select Hardware Monitor (on some devices, this might be under PC Health Status, H/W Monitor, or Advanced) > Review the CPU temperatures displayed.
-
Press Esc > Exit without saving, or follow the on-screen instructions to leave BIOS/UEFI.
Method 2: Through Windows Settings
-
Go to Start > Settings > System > Recovery.
-
Under Advanced startup, click Restart now.
-
After the restart, click Troubleshoot > Advanced options > UEFI Firmware Settings > Restart.
-
Your PC will boot into UEFI automatically. Look for your CPU temperature under menus like Hardware Monitor, PC Health Status, H/W Monitor, or Advanced.
-
Press Esc > Exit without saving (or follow on-screen instructions) to exit UEFI.
Without BIOS/UEFI
While they’re easily available, BIOS and UEFI aren’t ideal for monitoring CPU temperatures because they can’t monitor your PC while it’s in regular use. As CPUs rarely overheat during startup, you’ll likely need third-party software to track temperatures throughout your session.
There are several popular CPU monitoring tools available, including:
-
Core Temp: Lightweight, simple interface focused on per-core CPU temperatures with minimal system impact.
-
HWiNFO: Highly detailed, professional-grade monitoring with real-time sensors, logging, and hardware diagnostics.
-
Open Hardware Monitor: Free, open-source tool offering basic CPU, GPU, and fan temperature monitoring.
-
SpeedFan: An advanced utility that monitors temperatures and allows manual fan speed control on supported systems — best for older systems.
-
AMD System Monitoring: Official AMD tool optimized for Ryzen CPUs, showing accurate temperatures and performance metrics.
You can leave these third-party tools running during your active gaming or working session to monitor temps over time, getting an accurate picture of the temperature your CPU reaches during normal PC usage.
Here’s how to check your CPU temperatures using Core Temp:
-
Download, install, and launch Core Temp.
-
Review the Temperature Readings section:
-
Max and Min show the highest and lowest recorded processor temperatures for each core.
-
Load shows the current CPU load. A high load will typically correlate with a high temperature.

Here’s how to check your CPU temperature using HWInfo:
-
Download, install, and launch HWiNFO.
-
Select Sensors-only > Start.
-
Under the Sensor list look for:
-
CPU Package: shows the overall CPU temperature (best general reading).
-
CPU (Tctl/Tdie): shows the main CPU temperature used for cooling control and thermal throttling decisions.
-
Core Temperatures: show individual core heat levels.
Here’s how to check your CPU temperatures using SpeedFan:
-
Download, install, and launch SpeedFan.
-
On the main screen, look for CPU, Core, or Core 0 / Core 1 temperatures.
What is the average CPU temperature?
An average CPU temperature for a normal workload is anywhere between 104 and 149°F (40–65°C), depending on your processor. While running more intensive apps or games, the normal CPU temp range can increase to between 158 and 176°F (70–80°C).
On an Ultrabook — a very thin, lightweight laptop with minimal internal space — it’s normal for core temps to hover around 167°F (75°C) during an average workday.
In most cases, a bad CPU temp is 176–185°F (80-85°C) or above. There could be a serious problem if you’re reaching this temperature, especially without gaming or running any resource-intensive programs.
 CPU temperatures can range depending on the type of CPU you have and the tasks you’re running. Aim to keep temps between 104-149°F.
What is a normal CPU temperature for gaming?
On a desktop gaming PC with plenty of cooling and a high-end CPU, it’s normal to see CPU temperatures around 122°F (50°C) without running anything too demanding.
-
A normal CPU temp on a system that is optimized for gaming is usually between 149–185°F (65-85°C).
-
Average temperatures above 185°F (85°C)are fine for a few minutes of gameplay or other intense CPU use but sustained temperatures at this level can reduce CPU lifespan.
How do I know if my CPU is overheating?
You can check for overheating of your CPU by monitoring the CPU temperature. If your regular PC sits above 176°F (80°C) or your gaming CPU temp is above 185°F (85°C) for an extended period, it is likely overheating.
In addition, your computer will probably be hot to touch and you may notice performance issues, such as your:
-
Software lagging, freezing or crashing.
-
System shutting down unexpectedly.
-
Computer fans working harder than usual.
Prolonged periods at high temperatures can age hardware rapidly, so using a PC temperature monitor to manage overheating can help you keep your computer working well for longer.
How to monitor your CPU temperature continuously
You can consistently monitor your CPU temperature with the help of third-party CPU temperature tools like Core Temp, HWMonitor, and NZXT CAM. Monitoring your CPU temperature is important when you work with demanding applications, such as video editing software, gaming or when you use your computer in direct sunlight. These factors can contribute to an overheating CPU.
Using third-party CPU monitors
Some of the tools you can use to check your CPU temperature are also available as monitors that regularly notify you of temperature changes to your processor.
Here are some of the main third-party CPU monitoring tools for ongoing CPU monitoring:
-
HWiNFO: Real-time, detailed monitoring of CPU, GPU, voltages, and fan speeds with logging.
-
Core Temp: A lightweight tool showing per-core temperatures continuously with customizable alerts for safe operation.
-
Open Hardware Monitor: Free, open-source software that tracks CPU, GPU, and system sensors over time.
-
SpeedFan: Legacy tool for monitoring temperatures and fan speeds, allowing long-term fan control and performance adjustments.
-
HWMonitor: Simple, reliable logging of CPU, GPU, and motherboard sensor data for ongoing observation (some features are paid).
-
AIDA64: Professional suite offering continuous system monitoring, stress tests, and detailed sensor reporting.
-
NZXT CAM: Visual, user-friendly monitoring with historical graphs for CPU, GPU, and overall system usage.
-
MSI Afterburner: Mainly for GPUs, but also logs CPU temperatures over time during gaming or load.
-
AMD Ryzen Master: Official AMD tool providing continuous CPU monitoring and overclocking features.
-
Intel Extreme Tuning Utility (XTU): Monitors Intel CPUs continuously, with logging and stress-testing capabilities.
Most of the tools listed above aren’t available on macOS, but native Mac options like iStat Menus, Intel Power Gadget, MenuMeters, or Macs Fan Control provide continuous CPU monitoring, real-time temperature tracking and fan control.
Here’s how to monitor your CPU core temperature using Core Temp:
-
Download and install Core Temp.
-
Click the arrow in the notification area of your taskbar. The numbers displayed represent the temperatures of your CPU cores, typically showing two to four readings.

-
Click one of the numbers and drag it to your taskbar. Your real-time CPU temperatures will now be visible at a glance.

-
To display only the highest temperature of any of the cores, open Core Temp > Options > Settings > Notification Area > Select Highest temperature per processor > OK.

How do I monitor my AMD CPU temp?
You can monitor your AMD CPU temps with AMD Ryzen™ Master, which provides real-time monitoring of temperature, voltages, clock speeds, and other CPU metrics simultaneously.
Here’s how to monitor AMD CPU temps with AMD Ryzen™ Master:
-
Download, install, and launch AMD Ryzen™ Master > Look at Temperature or CPU for real-time CPU temperatures.
Whether you have AMD or Intel hardware, consider using specialized cleanup software like Avast Cleanup to optimize your system for maximum processor performance.
Monitoring your CPU temperature while gaming
If you’re a gamer, you can monitor your CPU temperature while in full screen with MSI Afterburner. This tool displays a discreet reading over your gameplay, so there’s no need to disrupt your gaming experience. The CPU monitoring tool is powered by RivaTuner Statistics Server (RTSS), which comes bundled with MSI Afterburner.
Here’s how to monitor your CPU temperatures while gaming:
-
Download, install, and launch MSI Afterburner > Click the settings icon > Select the Monitoring tab > CPU temperature > Show in On-Screen Display.

You can also choose to monitor GPU temps, RAM usage, or other key stats from the Monitoring tab. When you launch your game, your CPU temps and other selected metrics will show in the top-left corner of your screen.

Why is my CPU temp so high?
Your CPU executes millions of operations every second, generating significant heat in the process. Temperatures can rise especially quickly during resource-heavy tasks, when overclocking, if cooling fans are failing, or when dust or poor ventilation restricts airflow.
If these temperatures climb too high without you noticing, you may encounter system instability, crashes, performance slowdowns, and even long-term hardware damage.
Here’s more information about some of the most common causes of high CPU temperatures:
-
Intensive operations: Running multiple high-intensity tasks simultaneously can spike CPU temperatures.
-
Overclocking: Overclocking, which pushes your GPU beyond its programmed limits, can raise CPU temperatures, risking instability or throttling.
-
A faulty PC fan: If your fan isn’t working properly, cooling efficiency drops and you may notice unusually loud and persistent fan noise.
-
Dust buildup: Older computers may have a build up of internal dust, which can slow down and clog your fans, impacting your hardware’s cooling functions.
-
Limited PC ventilation space: If your PC is sitting on a surface that inhibits air circulation, or if you have a slimline laptop, there may not be enough space for effective ventilation. Keep your computer on a hard, flat surface that doesn’t trap air — or raise it using a laptop stand or cooler.
-
Too much system clutter: Excess storage and file clutter increase background activity and system load. Cleanup tools like Avast Cleanup remove junk files automatically.
-
Computer viruses: Computer viruses run hidden background processes, increasing CPU usage and system load. Find and remove viruses and other malware to restore performance and improve security.
What is the CPU over-temperature error?
A CPU over-temperature error occurs when the processor reaches a critical heat level, sometimes forcing the system to shut down. Exact limits depend on the CPU model, but most modern processors are designed to shut down around 212°F (100°C) to prevent damage.
Common causes include malware that drives excessive CPU usage, poor ventilation or exposure to heat sources, a failing cooling system, or excessive overclocking.
How to keep CPU temperatures down
You can keep CPU temperatures down by turning off background applications, keeping your PC and cooling fans clean, and ensuring your system is malware-free.
Here are some more detailed tips to help keep your CPU cool:
-
Clean your hardware: Remove the cover and use compressed air dusters to unclog the inner workings of your PC, including the CPU fan.
-
Remove unnecessary files and apps: Cleaning your PC storage can help reduce the amount of processing power being spent on background activities.
-
Use a laptop stand: A stand that lifts your laptop away from surfaces can help improve airflow and prevent overheating.
-
Keep your environment cool: Avoid placing your laptop or PC in direct sunlight, and keep the ambient temperature as cool as possible. Always turn off your laptop, or set it to idle or sleep mode, before putting it in a bag or case.
-
Replace your cooling fan: If the fans inside your PC aren’t up to the task, replace them with a more powerful air cooler or install a liquid-cooling solution.
-
Refresh your thermal paste: Thermal paste is a substance used to improve the transfer of heat between your CPU and the heat sink. Over time, it can degrade, contributing to overheating issues. If you’ve had your computer for a few years or more, applying new paste can improve heat transfer.
-
Keep your PC malware-free: Some viruses cause constant high CPU usage, drastically increasing the core load and temperature. Install a free antivirus to continually monitor your PC for threats and remove any malware before it causes problems.
-
Close background applications: Use a dedicated PC cleaner program to put resource-draining apps to sleep automatically, reducing the load on your system.
-
Try a PC optimization tool: Tools like Windows’ Storage Sense or Disk Cleanup, or dedicated software like Avast Cleanup, can identify performance hogs and help keep your PC running smoothly.
Help keep your PC running smoothly with Avast Cleanup
A computer that's clogged with unnecessary files is more likely to overheat, experience slowdowns, and even crash. By removing junk files, optimizing background apps, and improving efficiency, Avast Cleanup helps keep your CPU cool and your system running smoothly — whether you’re gaming, working, browsing, or juggling all three. Try Avast Cleanup for free today.
What customers say
More Performance Articles

Why Your Mouse Is Broken or Not Working and How to Fix It

What Motherboard Do I Have & How Do I Find Out?

How to Check and Monitor Your CPU Temperature

SSD vs. HDD: Which Do You Need?

What Is the Difference Between Thunderbolt and USB-C?

11 Reasons Why Your Phone Is Overheating

AMD vs. Nvidia: Which Is the Best GPU?
AMD vs Intel: Which CPU Is Better in 2023?

What Is a Solid-State Drive (SSD)?

What Is RAM and Why Does Random Access Memory Matter?

How to Check How Much RAM You Have on Windows PC or Mac

How to Check Specs on Windows PC
Hardware
Performance
Jeremy Coppock
3-07-2023